I’m recording a Loom walkthrough of a new feature when I notice something broken—unrelated to what I’m demoing. A year ago, I would have logged a Linear issue. It would sit in triage for a week, get prioritized in a meeting, eventually get picked up. Now I open Claude Code, screenshot the bug, and type: “Why is this broken? Make me a plan to fix.”
I have a backlog of about twenty of these. My motivation for logging issues has never been higher, because there’s a fair chance I can ship a fix in under an hour.
The Problem with DORA
I knew about DORA metrics from the Accelerate book—lead time, deployment frequency, the usual. DORA’s “elite” threshold for lead time is less than one day from commit to production. But their measurement starts at first commit. In agentic development, the first commit isn’t the start of work—it’s closer to the end.
When I pick up a Linear issue now, my workflow looks like this: grab the branch name, create a worktree, start a Claude Code session, paste in the issue link. My first message is usually something like “Go read this issue and all the context. Let’s make a plan to deliver it and discuss once you’ve had a chance.” That message—“let’s make a plan”—is when I’ve started working. Not the commit. The commit comes later, after exploration, discussion, dead ends, revisions. The traditional metrics miss all of that.
Measuring from First Prompt
Claude Code stores conversation history as JSONL files in ~/.claude/projects/. Each message has a timestamp. And because I use Claude Code to create my pull requests, the conversation includes a GitHub URL when the PR is opened. So the measurement becomes straightforward: find PR URLs in session files, get the first message timestamp from that session, query GitHub for when the PR merged, calculate the delta. I wrote a bash script to do this. It took a couple hours—and yes, I used Claude Code to build it.
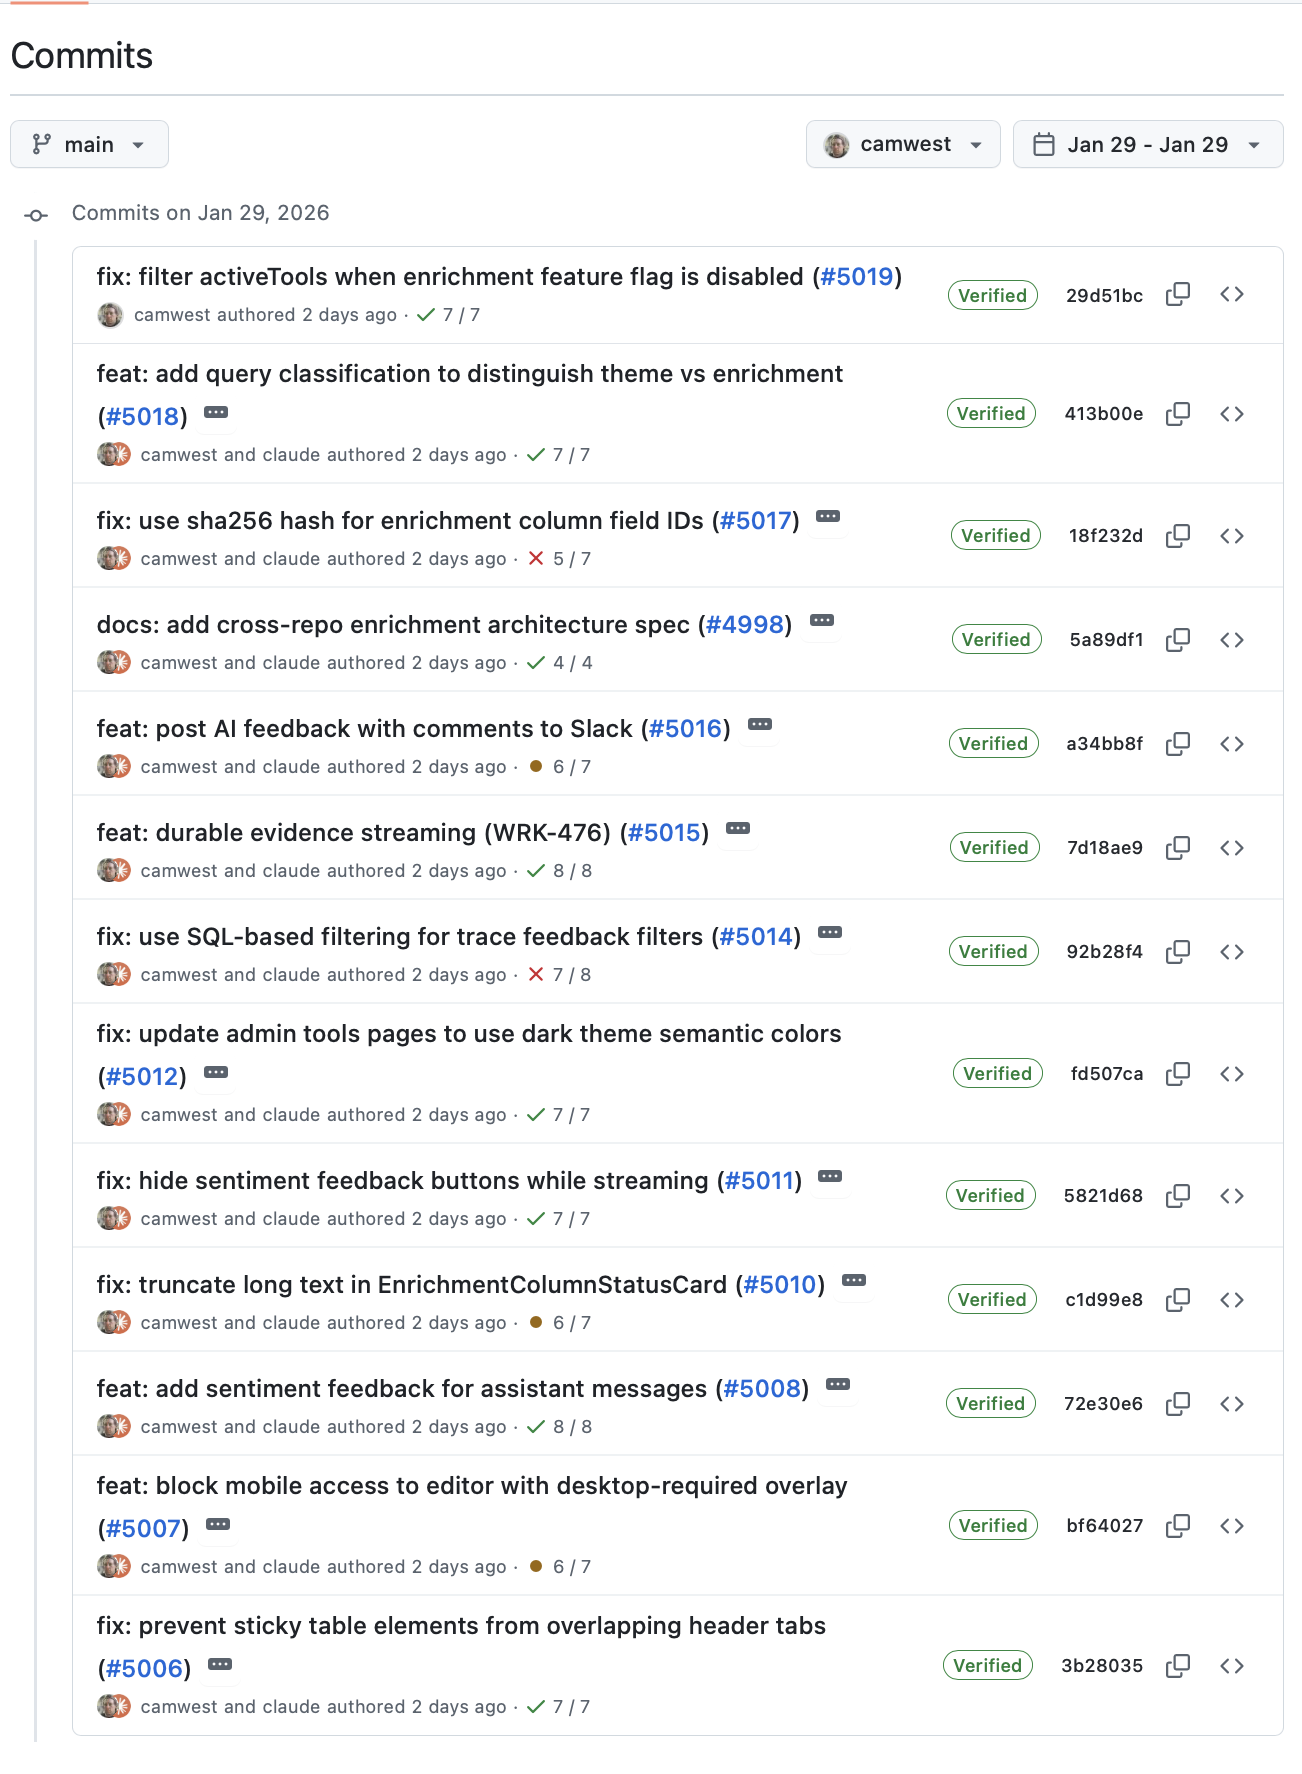
This week I merged 40 PRs. All initiated through Claude Code conversations.
| Metric | Value |
|---|---|
| Average cycle time | 5h 10m |
| Median cycle time | 1h 11m |
| Fastest | 9 minutes |
| Slowest | 1 day |
The distribution is bimodal. Twelve PRs landed in the 30-60 minute range—quick fixes, small features. Sixteen took over two hours—more complex work that required back-and-forth. The week before was similar: 31 PRs, median of 2h 14m.
For context, DORA’s elite threshold for lead time is under one day. My median is about 20x faster than that floor. We run continuous deployment—merge goes straight to production, gated by tests and feature flags. So I’m measuring the same endpoint DORA measures (production), just with a different starting point: first prompt instead of first commit.
A Fitness Tracker, Not a Leaderboard
I’m not interested in comparing myself to other developers. What I’m interested in is whether I’m improving. Can I break work into smaller pieces? Ship faster? What’s slowing me down? I think of this like a fitness tracker—am I matching my personal best?
The usual objection: Goodhart’s Law. “Developers will game it—split one logical change into five PRs just to hit numbers.”
But why wouldn’t you? Smaller PRs are easier to review, lower risk, faster to merge. That’s not gaming—that’s exactly the behavior DORA research says correlates with high performance. I actively encourage my teammates to break work into smaller pieces.
The truly wasteful gaming—whitespace-only fixes, trivial comment tweaks—doesn’t survive in practice. PRs are public. Your team sees what you ship. Social pressure handles the noise.
What I’m less sure about: does this work for teams? For paired work where context transfers between people? I’ve only measured my own workflow, where 100% of my PRs start in Claude Code. Your mileage may vary.
The Script
If you want to try this yourself, I’ve published the script as a GitHub Gist. You’ll need the gh CLI authenticated with GitHub. Point Claude Code at this blog post and it’ll do the rest.
Here’s what the output looks like:
PR Cycle Time - CW05 (Jan 26 - Feb 01)

Merged PRs:        40
Avg cycle time:    5h 10m
Median cycle time: 1h 11m
Fastest:           9m
Slowest:           1d 0h

Distribution:
< 15 mins  ██ 2
15-30 mins ███ 3
30-60 mins ███████████████ 12
1-2 hours  ████████ 7
2+ hours   ████████████████████ 16
40 PRs in a week. Median cycle time of an hour. The work happens in conversation now, and the traces are there to measure it.
I don’t know if this is the right metric for everyone.
Process note: I used Claude Code to help structure and edit this post. The observations, data, and opinions are mine.